
Request logs
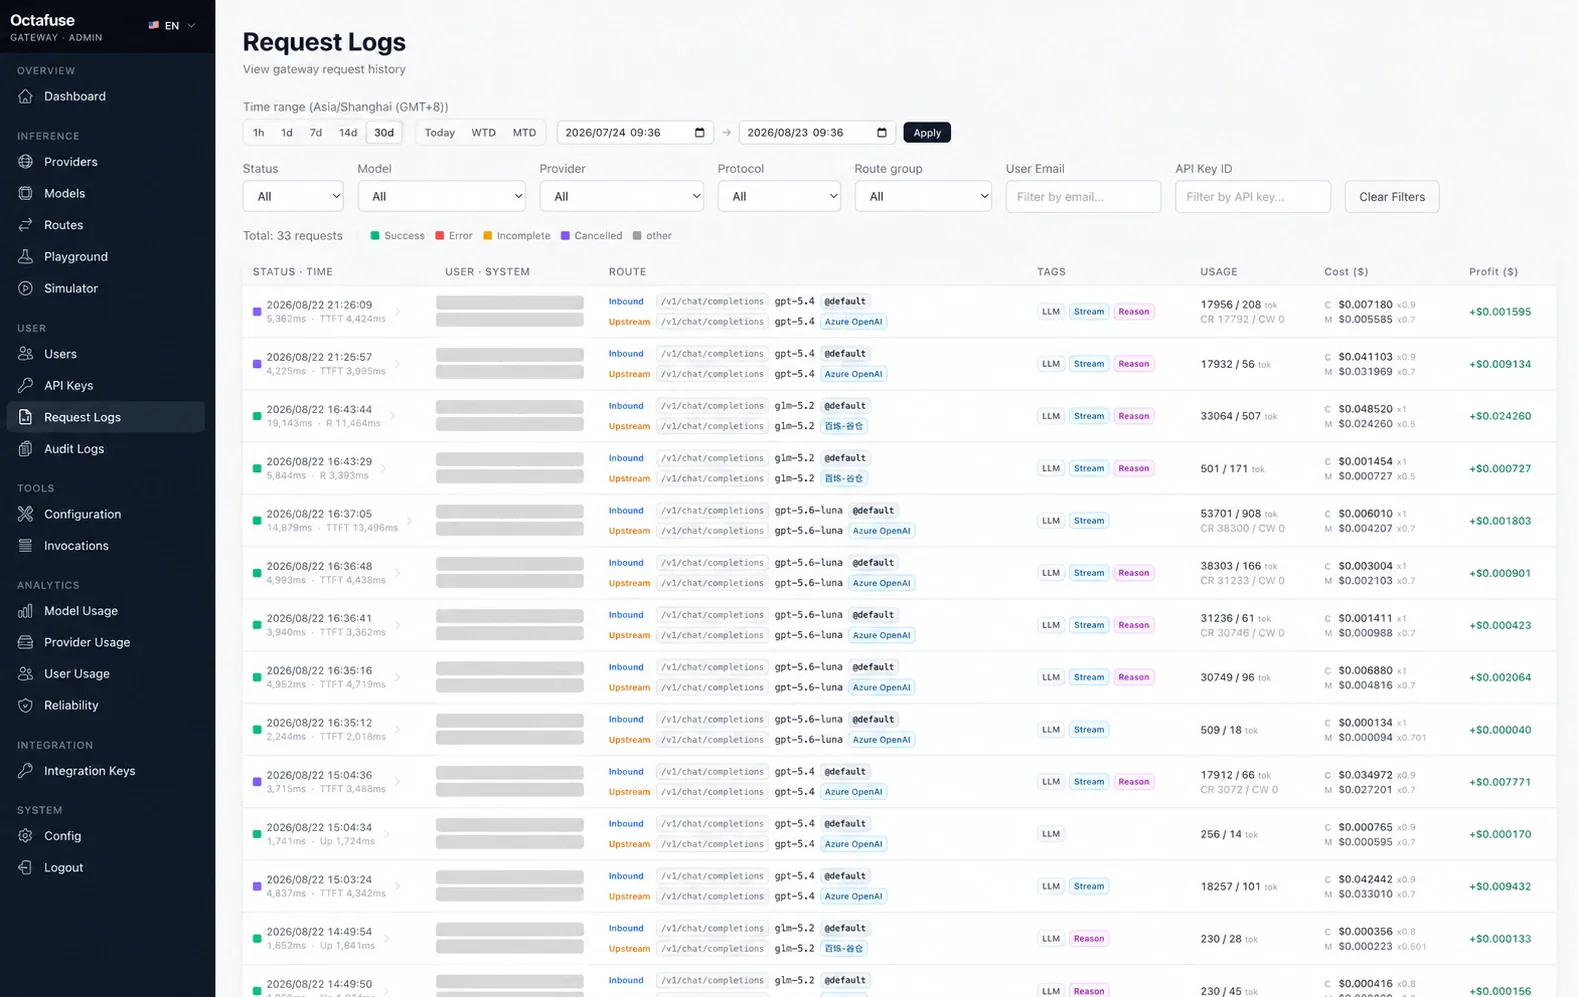
Open User → Request Logs. This view lists real inference calls through the Proxy: time, user, inbound client surface, actual upstream, model, Route Group, Provider, usage, and cost — useful for troubleshooting and reconciliation.
What to do in Admin
Section titled “What to do in Admin”- Open Request Logs.
- Narrow results with time range, status, model, user email, API key, vendor, route group, protocol, and other filters available on the page.
- In the row, compare Inbound and Upstream paths, model, Route Group, Provider, capability tags, and usage.
- Expand a row to inspect billing-audit snippets, request bodies, upstream bodies, and raw usage JSON (copy when provided).
- When reading money and timestamps, align with your system timezone and billing currency settings in Admin.
Billing display
Section titled “Billing display”C in the list is the final user charge (Charged); M is supplier cost (Metered). Adjacent factors help identify route schedule and per-model user discounts.
Expanded pricing_audit data records catalog rates, route factors, and final totals. New 2.7.0 rows can also include user_charged_factor, the business-timezone local_weekday, and the matching schedule window, making the catalog → route → user-factor calculation traceable.
For exact formulas or finance reconciliation, follow your internal policy plus the GitHub technical reference.
Observe Provider Sticky
Section titled “Observe Provider Sticky”When a Route Pool has Provider Sticky enabled, expand route_trace.sticky in the request log:
lookupis the binding lookup outcome, such ashit,miss,expired,invalid_epoch,invalid_target, orinvalid_circuit.attempted_targetis the bound Target tried before normal priority tiers.resultshows whether the binding was kept, cleared, created, or rebound; it can also reportstorage_errororunchanged.
Compare Sticky outcomes with cache-read tokens and upstream failover counts. If hits are stable but cache benefit does not improve, verify that the upstream really shares Prompt Cache state. Frequent cleared / rebound results point to Provider 429s, 5xx responses, auth failures, or an unsuitable TTL.
- Audit logs — budget and account-side changes
- Routing — four strategies and Provider Sticky
- Simulator — browser-based calls to the Proxy with a real key